How this college empowers Canvas admins with Intelligent Insights

As one of the first institutions to adopt Intelligent Insights by Instructure, Florida State College at Jacksonville (FSCJ) was excited to test the capabilities of the premium analytics offering for Canvas Admins and share their perspective at InstructureCon 2024.
For its smaller team, an analytics hub that brings together accessible data around student success, course readiness, and LTIs is a welcome tool for making an impact on its students and faculty.
The college offers 157 total degree and certificate programs, and serves a diverse student population of more than 50,000 traditional and non-traditional students. Awarding more than 8,600 degrees annually, FSCJ plays a significant role in supplying the region’s employers with a highly skilled, educated workforce, which is why driving student success remains a priority for the college.
However, like many institutions, FSCJ had a great need for accessible data to help drive deeper student engagement and success efforts. The team wanted to understand how to make the most impact, in particular, ways to hone their process for course preparation and student advising before the end of a semester.
Improving Course Readiness for impactful learning experiences
With Intelligent Insights, the Course Readiness dashboard helps admins determine if online courses are ready for students prior to enrolment. It allows users to efficiently manage and measure the effectiveness of courses to ensure high-quality, impactful learning experiences.
“Course Readiness dashboards allow you to set multiple sets of criteria depending on your needs,” said Jody Taylor, Canvas Administrator and Engineer at FSCJ.
“You can create minimum standards of what you want or even maximum standards of what your ideal course would have. With course readiness, a lot of people think, ‘Are courses ready at the start?’ But you can actually spot-check throughout the term to make sure that there's engagement—for example, that the instructor is adding announcements.”
The FSCJ team appreciates having the ability to see whether there are discussion submissions and collaborations among students or if instructors have added announcements. The flexibility this feature provides is helping the college pinpoint specific courses to review and send reminders to instructors. With visual data available to share, they can then make decisions about how to step in with helpful guidance.
In the short time the team has leveraged Course Readiness, they have been able to improve course quality, help free up student helplines and improve student satisfaction, as well as support faculty when and where needed.
“We can make data-driven decisions, which is also tied to enhanced compliance and ensuring regular substantive interaction, as well as required by the Department of Education,” Jody said.
Putting data to work for Students in Need
The Students in Need feature within Intelligent Insights helps admins identify students who may need additional support within a course, and admins at FSCJ are already seeing success with it. By analysing things like current core scores, on-time submissions, missing submissions, recent logins, and more, the team can find opportunities to help students in a timely way.
This tool gives advisors permission for the analytics portion of Canvas to access the student grade data they need for early interventions. At FSCJ, the goal is to empower student advising across our campus by providing admins the flexibility to see the information they’re most interested in, such as the last two weeks, or missed and late assignments.
One interesting way that the school uses these analytics is by running a student-in-need report before the term withdrawal date. Advisors can then send a message to students who may be at risk of withdrawing, conduct a health check, and see how things are going. With the ability to reach out, educators have a better chance to impact students’ willingness and ability to continue to be enrolled in a course.
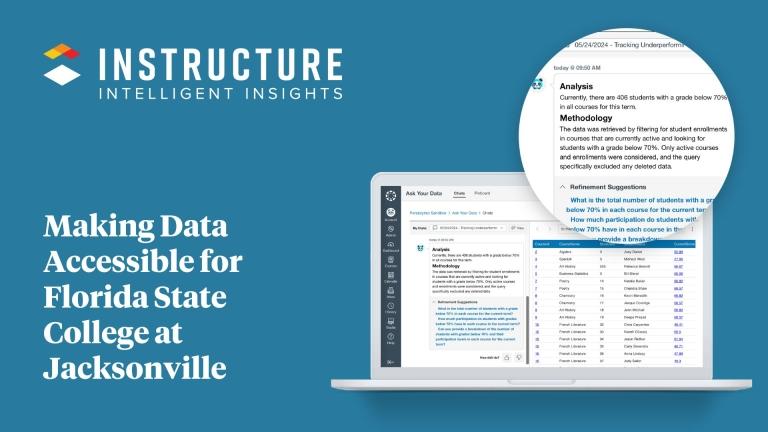
Using custom insights with Ask Your Data
With the Ask Your Data tool, powered by AI, admins can ask natural language questions and receive textual or visual responses pulled from data solely within their institution’s Canvas environment.
After familiarising themselves with the tool, the team learned that the Ask Your Data tool works best when asked questions using Canvas terminology. It generates graphs and charts summarising key data that can be shared with faculty and staff, as well as custom reports that can be saved and automated.
The team likes the ability to ask the tool various questions about their data, said Thomas Lewis, Canvas Administrator and Engineer at FSCJ, who shared that the team asks questions like:
- Is there a correlation between a student’s course completion and their average assignment scores?
- What’s the correlation between assignment override frequency and student performance?
- What’s the amount of courses that are published and unpublished?
Understanding LTI usage within Canvas LMS
The Learning Tools Interoperability (LTI) Usage dashboard helps admins survey the tools being used within Canvas LMS so they can make informed decisions about implementation, migration, usage, and/or renewal.
Admins at FSCJ can sort, filter, and search across tools and drill down into details, which helps with making decisions on how to use, implement, and migrate tools in a more informed way. And admins aren't the only ones excited about this dashboard.
“I have to say when we were presenting this to our CIO, he was most excited about this dashboard,” Jody said. The team sees the LTI Usage dashboard’s potential for helping the institution save money and values having the data to back up their decisions. “We can present the data saying here's why we need to maybe get rid of this LTI,” Jody said.
As Florida State College at Jacksonville heads into a new term, they’re continuing their use of Intelligent Insights and finding more ways to streamline their approach to preparing courses, identifying at-risk students early, and leveraging data to increase student success and institutional effectiveness.
Interested in learning more?
Watch our webinar on driving student success with Intelligent Insights, led by our APAC team.
Related Content
 philippines_ched_cmo.png
Blogs
 meet-canvas-apac-team-avi.png
Blogs
 mom_and_baby_with_laptop_2.jpg
Blogs